Frosted 12 EMAsBased on Vykorowsky's 6 EMAs.
This indicator creates 2 separate fans of 6 EMAs each (12 in total).
Everything is configurable in the settings screen.
Cerca negli script per "3 ema"
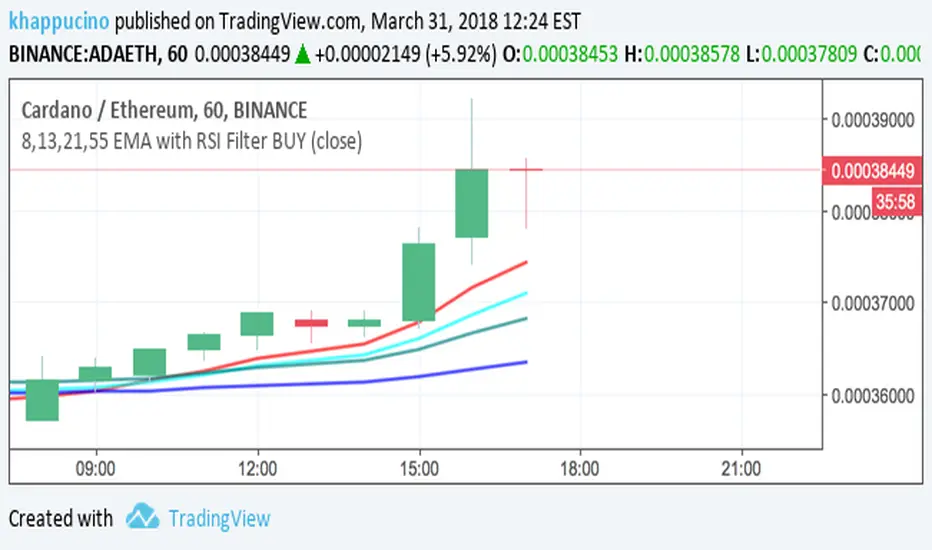
Fibonacci Exponential Moving Averages ( EMA )Here you can have 4 EMA on one indicator. The inputs are for 8, 13, 21 and 55 previous open&close which are from Fibonacci sequence.
How to : To use the script, click on "Add to Favourite Scripts", then load the script from Indicators on the Chart.
Fibonacci Exponential Moving Averages ( EMA )
Have 8, 13, 21 and 55 EMA on one indicator ! enjoy :)
R.N

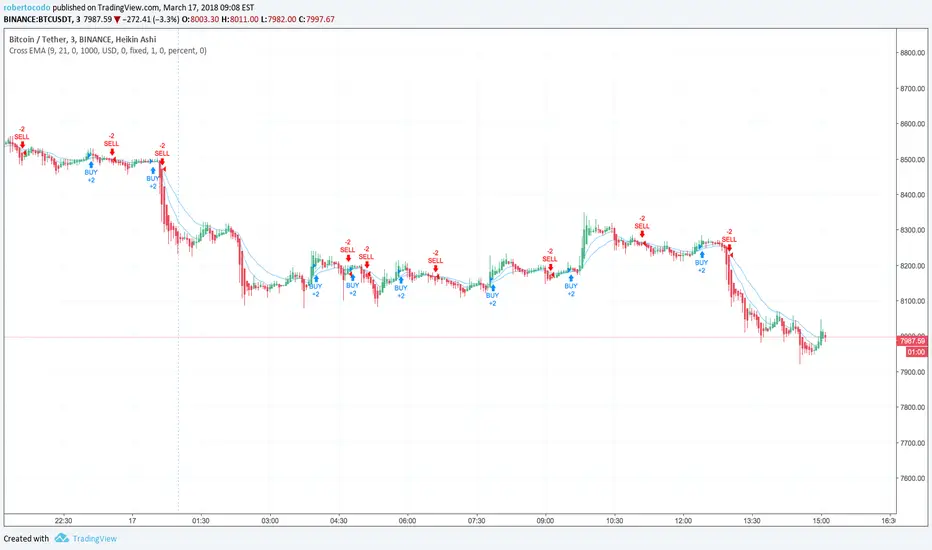
SW SVE - Stochastic+Vol+EMAs [Sergio Waldoke]Script created by Sergio Waldoke (BETA VERSION v0.5, fine tuning PENDING)
Stochastic process is the main source of signals, reinforced on buying by Volume. Also by Golden Cross.
Selling is determined by K and D entering overselling zone or EMA's Death Cross signal, the first occurring,
and some other signals combined.
Buy Long when you see a long buy arrow.
Sell when you see a close arrow.
This is a version to be tuned and improved, but already showing excelent results after tune some parameters
according to the kind of market.
Strategy ready for doing backtests.

Philakone 55/100 EMA incl. color & sizeInspired on Philakone's EMA settings in his colors and line width. Also added 100 EMA.
Commodity Channel Index + 2 EMAsThis cript is from CCI chart with 2 aditional Exponential Mean Average from CCI. The default setup works better on H1 graph.
The EMAs are from CCI.

Always show daily EMAThis script will always plot the daily EMA regardless of which timeframe you are on.

Ema(Ema10,10) Ema(Ema21,21) crossover strategyThis code works better in 1 hour for crypto currencies like BTC 1.51% or LTC.
It seems to beat the market. Feedback or improvement are welcome.

4 Ema Exponential Moving Average CombinationYou don't need to open 3-4 different EMA indicators. Just use this one and save some slots for other indicators ! Enjoy !

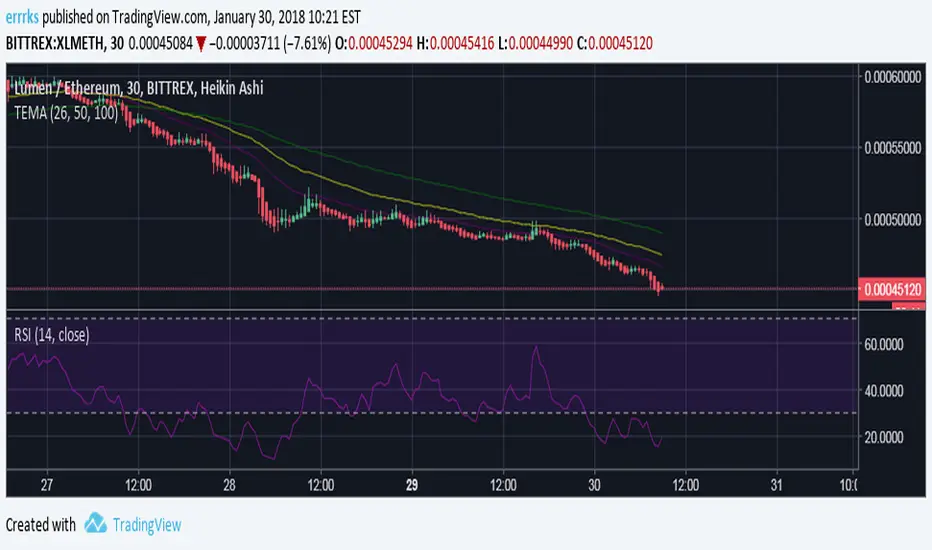
Triple EMADisplays the EMA for the values set in the Length variable.
Colors can be changed through the plot line of code.
4 EMA's in oneAnother useful script I've been experimenting with. 4 EMA's in one!
Red = 200
Orange = 100
Yellow = 50
Blue = 25
Color coded in order of their respective frequencies.
Right now it's as plain and simple as you can get. Only inputs you can change are the average values.
Will update upon request and popularity.
Happy new year and God bless!

Cuathro EMA StrategyIt's a long term script based on multiples EMA, crossover and crossunder.
Based on two good scripts CM Sling and OCC.
Always adjust resolution at least twice than chart.
Enjoy it! BTCUSD

HL2 - 22 EMA Cross for RenkoEURUSD
This is a simple strategy to use for those who like Renko bars. I ONLY use it on Renko.
Basic idea is that when the Renko bar closes above or below the 22 EMA, you go long or short.
However, some of the frustrations I've had with any strategy shared in Tradingview is so few folks put in the ability to set a stop or a profit target or the ability to set a specific time to trade. I have added those to this strategy. (And I for the life of me can not remember where I got the code for the the time, I need to find you!).
Special note: If you have never used the Renko bars in Tradingview, make sure you click the Format option next to whatever pair you are looking at and change it from Traditional to ATR. You can set it for a static pip amount if you want. But ATR at first will help you decide which amount of pips you should throw in.
This is my first published strategy so if I screwed up on anything or didn't explain it very well, please let me know!!


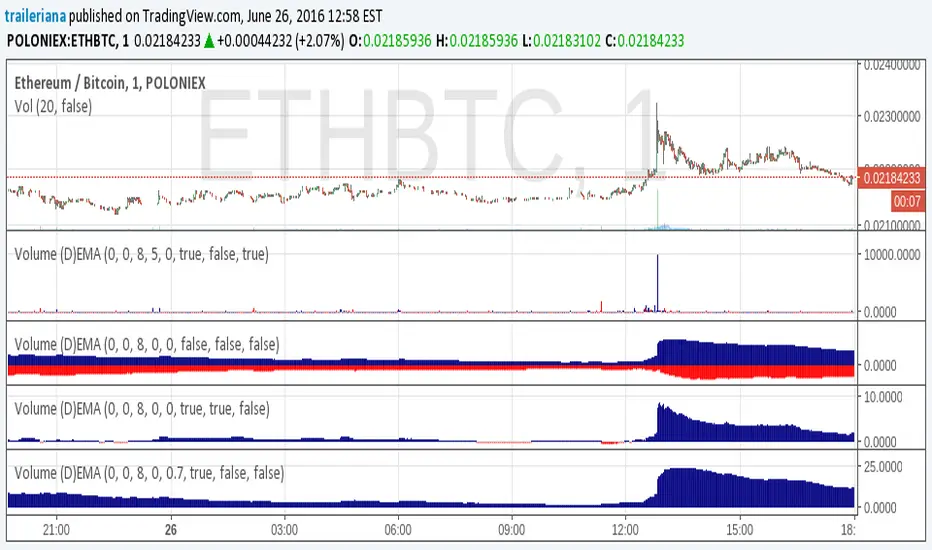
Volume (D)EMAA simple yet configurable indicator that shows recent traffic volumes.
The time period is specified as weeks/days/hours/minutes, not as bars.
Set the volume period to non-zero if you want to use a generalized double EMA instead of plain.
The "ratio" option will show the size of the current volume compared to the average volume as computed for the specified time period; say hello to fat tails and goodby to "standard" and "normal" and "average". With the "together" option, it compares the current volume to the both sides together (buy+sell), otherwise it compares it to just its respective side.
Volume (D)EMAA simple yet configurable indicator that shows recent traffic volumes.
The time period is specified as weeks/days/hours/minutes, not as bars.
Set the volume period to non-zero if you want to use a generalized double EMA instead of plain.
The ratio option will show the size of the current volume compared to the volume in the specified time period (expect to see something very non-Gaussian, say goodby to trusting your ATR and stddev, and say hello to fat tails.) With the "together" option, it compares the current volume to the both sides together (buy+sell), otherwise it compares it to just its own.


Ichimoku EMA BandsSome find Ichimoku Clouds bit complicated. This simplified version is combined with EMA Bands may be profitable. Give a try!. I recommend hourly timeframe for good results. Aye! :D

[JR] Multi Bollinger Heat Bands - EMA/Breakout optionsA little, yet hopefully useful update over my previous "Multi Bollinger Heat Bands". For those who like quick visual cue's.
In short: It's your Basic Bollinger Bands, but 3 of them, and some pointy things.
In full:
Three stacked SMA based Bollinger Bands designed just to give you a quick visual on the "heat" of movement.
Set inner band as you would expect, then set your preferred additional multiplier increments for the outer 2 bands.
Option to use EMA as alternative basis, rather than SMA.
Breakout indication shapes, which have their own multiplier (but still tied to same length/period as the BB's) so you can make them pop on their own separate "band".